The dashboard is a 1990s idea that overstayed its welcome.
Here’s the heresy, stated plainly: the dashboard the grid of charts you navigate, filter, and drill into is an artifact of a constraint that no longer exists. We built dashboards because asking a database a question required someone who could write SQL, so analysts pre-answered the likely questions and arranged the answers on a screen. The dashboard was always a workaround for the fact that business users couldn’t talk to the data directly.
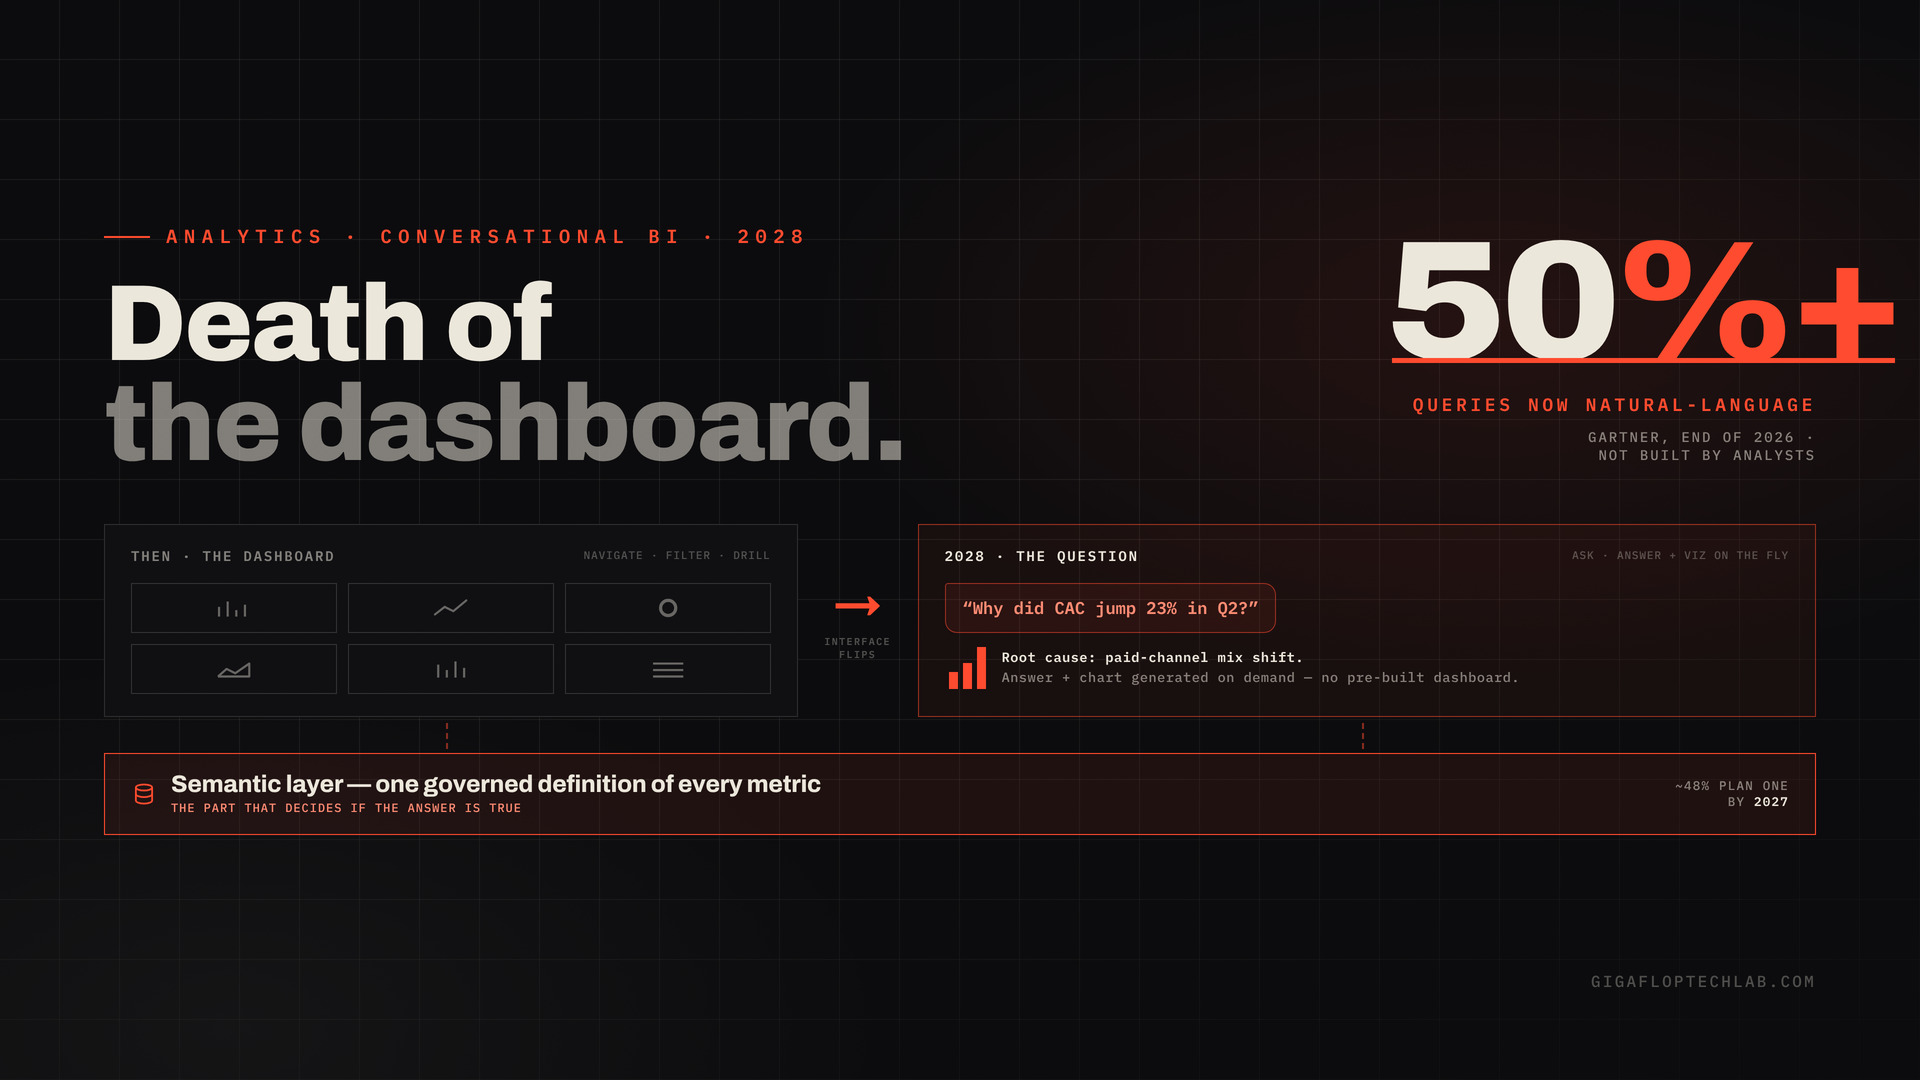
That constraint is gone. And when the constraint that created a tool disappears, the tool follows not overnight, but inevitably. By 2028, the default way an executive interrogates the business won’t be opening a dashboard and hunting for the chart. It’ll be asking, in plain language, “why did CAC jump 23% in Q2?” and getting a root-cause answer with the visualization generated on the fly.
Let me make the bold case, then be honest about exactly where it’s wrong because “death of the dashboard” is a useful provocation, not a literal forecast, and you deserve the precise version.
The bold case: the dashboard as default destination is dying
The shift: from navigating pre-built answers to asking questions directly. The dashboard assumes someone anticipated your question in advance. Conversational BI removes the assumption you ask whatever you actually want to know, including the follow-up the dashboard-builder never imagined.
The evidence (dated, and stronger than the skeptics expect):
- Gartner estimates that by the end of 2026, more than 50% of enterprise analytics queries will be generated via natural language, search, or voice not built by analysts through drag-and-drop (Gartner, 2026). When the majority of queries already bypass the dashboard-building workflow, the writing is on the wall.
- The conversational BI market is projected to reach roughly $28 billion by 2028, growing ~21% a year (industry analyses, 2026).
- The tell that matters most: the incumbents agree. Google’s Looker, ThoughtSpot, Microsoft, and the rest have all bolted conversational, natural-language access onto their platforms explicitly to reduce reliance on static dashboards (2026 platform analyses). When the dashboard vendors are racing to add a chat box, they’ve read the same tea leaves.
- And the role itself is dissolving: Gartner projects the distinction between “people who build dashboards” and “people who view dashboards” collapses as anyone can ask a question and get a visualization (Gartner, 2026).
The implication: the center of gravity in BI moves from the dashboard to the question. The analyst’s job shifts from building and maintaining dashboards to curating the trusted foundation those questions run against (more on that below it’s the whole ballgame).
What to do now: stop measuring your analytics maturity by dashboard count. Start asking: can a non-technical person get a trusted answer to a question nobody pre-built? If not, that’s the gap to close.
Now the honest part: what “death of the dashboard” gets wrong
A prediction you can’t falsify is worthless, so here’s where the provocation overshoots and the most credible voices in the space say so directly: this is not a replacement story, it’s an evolution story; dashboards remain essential infrastructure (industry analysis, 2026). Three things the “death” framing gets wrong:
- Dashboards survive as artifacts, not as the default interface. Monitoring a known set of KPIs at a glance the morning operational scan is something a well-designed dashboard does better than a conversation. You don’t want to ask “how are sales today?” every morning; you want to see it. Standing, glanceable views persist. What dies is the dashboard as the place you go to explore.
- “Replace Looker by 2028” is a paradigm claim, not a product obituary. Looker (and ThoughtSpot, and Power BI) won’t vanish they’re becoming the governed engine underneath the conversational layer. The dashboard tool of 2028 is a conversational interface sitting on the same semantic foundation. The brand survives; the primary interaction mode flips.
- The conversation is only as trustworthy as the layer beneath it which is the catch that makes or breaks the whole prediction, and the part most “death of the dashboard” hot takes ignore entirely.
The data-engineering catch that decides everything: the semantic layer
Here’s where the analytics-trend story becomes a data-engineering story, and why most conversational-BI rollouts quietly fail. A dashboard is governed by construction: an analyst defined “revenue,” chose the join, vetted the number before it shipped. A conversational interface has no such guardrail it will confidently answer “what was revenue last quarter?” using whatever definition it infers, which may be wrong in a way no one catches until it’s in a board deck.
The fix, and the real enabler of this entire shift, is the semantic layer: a governed definition of your metrics, entities, and business logic that both dashboards and AI agents query, so “revenue” means the same vetted thing whether a human builds a chart or an agent answers a question. The 2026 consensus is explicit the semantic layer becomes the context engine for AI and the consistency layer for BI, and ~48% of data & analytics leaders plan to implement one by 2027 (Gartner D&A Summit, 2026).
This is the unglamorous truth under the flashy prediction: conversational BI is a data-engineering achievement wearing an interface. The chat box is easy. The governed semantic layer that makes the chat box trustworthy is the hard, valuable work and the organizations that win the conversational era will be the ones that built that foundation, not the ones that bought the slickest chat UI. Without it, you haven’t democratized insight; you’ve democratized a way to be confidently wrong at scale.
What this means for the analytics org
The role doesn’t disappear it moves down the stack and up in value:
- From dashboard factory to semantic-layer steward. The analyst’s highest-value work becomes defining and governing the metrics layer the whole org (humans and agents) queries not churning out the 200th dashboard nobody opens.
- From gatekeeper to enabler. When anyone can ask, the analyst stops being the bottleneck for every question and starts being the architect of trust.
- From “what happened” to “why and what next.” Dashboards show what happened; conversational/decision-intelligence systems increasingly explain why and recommend what to do and that’s where analytical talent should aim.
Conclusion
The dashboard isn’t dead, and anyone who tells you it is, is selling something. But the dashboard as the default place you go to ask a question of your data is on its way out, and by 2028 the primary interface will be conversational the evidence (a majority of queries already natural-language, a multi-billion-dollar market, the incumbents themselves pivoting) is too consistent to wave away.
The provocation in the title is half-right, which is the most useful kind. What actually replaces the dashboard isn’t a chat box — it’s a chat box on a governed semantic layer. The interface is the part everyone will see. The semantic foundation is the part that decides whether the conversation tells you the truth. Build that, and you’re ready for 2028. Buy a chat UI without it, and you’ve just made it faster to be wrong.
CTA
Thinking about conversational analytics and want it to be trustworthy, not just fast? The interface is the easy part; the governed semantic layer underneath is what makes it safe.
Explore Modern BI Architectures → we’ll assess whether your data foundation can actually support trusted conversational BI (semantic layer, governed metrics, data quality) before you bolt a chat box onto numbers you can’t yet trust. For the broader outlook, subscribe to The Gigaflop Brief.
FAQs
Not entirely it replaces the dashboard as the default way to explore data, not as an artifact. By 2028, the primary interface for asking questions will be conversational, with Gartner estimating over half of analytics queries already coming via natural language by end of 2026. But glanceable dashboards for monitoring known KPIs persist. It’s an evolution, not a clean replacement.
Conversational BI lets users ask questions of data in plain language “why did churn rise last month?” and get answers with automatically generated visualizations, instead of navigating pre-built dashboards or writing SQL. It shifts the center of gravity from the dashboard to the question, and is among the highest-adoption generative-AI use cases in 2026.
No it moves their work down the stack and up in value. Instead of building the 200th dashboard, analysts become stewards of the semantic layer (the governed metric definitions the whole organization queries) and shift toward explaining why things happened and what to do next. The role becomes architecting trust rather than being the bottleneck for every question.
Because the chat box is easy and the trustworthy foundation is hard. Without a governed semantic layer, a conversational interface will confidently answer using whatever metric definition it infers which can be wrong in ways no one catches until it’s in a board deck. Buying a chat UI on top of ungoverned data democratizes a way to be confidently wrong at scale.
A semantic layer is a governed, central definition of your metrics, entities, and business logic that both dashboards and AI agents query so “revenue” means the same vetted thing regardless of who or what asks. It’s the consistency and trust foundation that makes conversational answers reliable. Around 48% of data and analytics leaders plan to implement one by 2027.
It’s a paradigm claim, not a product obituary. Tools like Looker, ThoughtSpot, and Power BI won’t disappear most are already adding conversational, natural-language access themselves. They’re evolving into the governed engine underneath the conversational layer. The brand survives; what flips is the default interaction mode, from navigating dashboards to asking questions.