Walk into most predictive analytics initiatives and you’ll find a team reaching for the most sophisticated model they’ve heard of, an LSTM, a Transformer, something with “neural” in the name, before they’ve checked whether their data can support a simple moving average. The model is the exciting part, so it gets the attention. Then the project stalls, not because the model was wrong, but because the data feeding it was a mess and the forecast never made it into anyone’s actual workflow.
This is the hype trap in operational forecasting, and it’s expensive. The pragmatic truth, unglamorous and exactly why it gets skipped, is that when you’re forecasting demand, inventory, capacity, or staffing, your accuracy ceiling is set by your data and your integration, not by your model’s sophistication. A brilliant model on messy data underperforms a simple model on clean data, every time. This is the no-hype version: how to build a forecasting stack that matches model complexity to the actual problem, starting simple and escalating only when the data justifies it.
To be clear up front, because honesty matters here: this isn’t an argument that simple always beats complex. Deep-learning models genuinely win in the right conditions. The argument is that you should earn your way up to them, and most operational forecasting never needs to.
The hype trap: starting at the top of the model ladder
The pattern that kills forecasting projects is starting with the most complex model and working down only when it fails. It’s backwards, for concrete reasons.
- Deep models are extremely data-hungry. A simple linear model needs historical data and maybe one influencing factor. A deep Transformer needs large historical datasets plus several external data sources to perform. Most operational forecasting problems don’t have that data volume, so the fancy model starves.
- Complexity has costs beyond accuracy. Deep models are harder to run, more expensive in compute, slower to iterate, and far less interpretable. When an ops leader asks “why is the forecast saying that?”, a black box is a real liability, and in many operational settings interpretability beats a marginal accuracy gain.
- Accuracy depends heavily on data preparation. The same research that touts high ML accuracy is explicit that it hinges on data cleaning, missing-value handling, and feature selection. The model is the last mile; the data is the road.
The result: teams spend months on a sophisticated model that a simpler one would have matched, while the actual bottleneck, data quality, goes unaddressed. And data quality isn’t a side issue. Data-quality problems hit revenue at roughly a third of organizations.
The pragmatic stack: match complexity to the problem
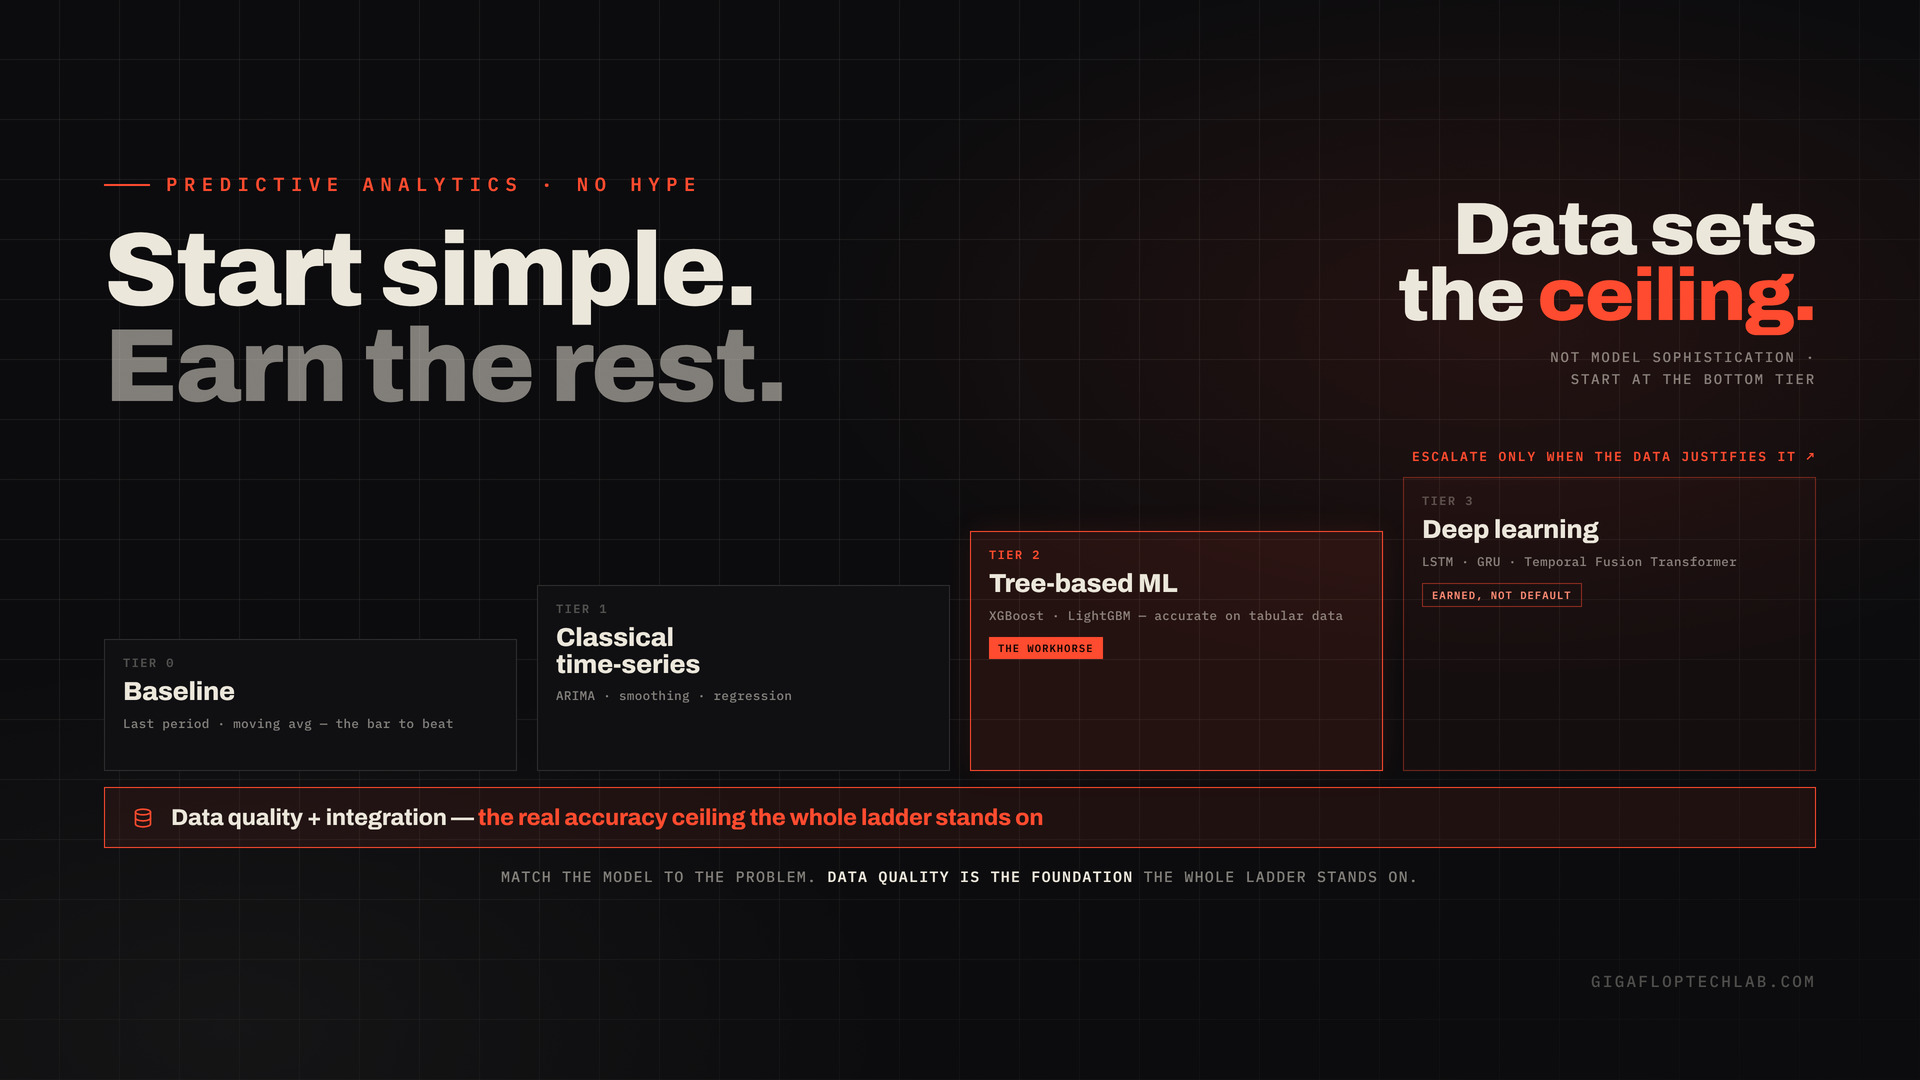
Here’s the escalation framework for operational forecasting, the same least-sufficient-tool discipline applied to models. Start at the simplest tier and move up only when the accuracy gap and the data genuinely justify it.
Tier 0: a baseline (always start here)
Before any model, establish a naive baseline: last period, same period last year, or a moving average. This does two essential things. It’s often good enough for low-stakes forecasts, and it becomes the bar every fancier model has to beat to justify its complexity. The single most skipped step in forecasting is checking whether your sophisticated model actually beats “same as last week.” Many quietly don’t.
Tier 1: classical time-series and simple regression
Methods like exponential smoothing, ARIMA-family models, and linear regression with a few causal factors handle a large share of operational forecasting: clear seasonality, trend, a known driver or two. They’re cheap, fast, interpretable, and need only modest data. For most demand, inventory, and capacity forecasting, this tier is the destination, not a waystation.
Tier 2: tree-based ML (the workhorse)
Gradient-boosted trees (XGBoost, LightGBM, and kin) are the pragmatic sweet spot when you have multiple features and non-linear relationships. They’re accurate, far less data-hungry and more interpretable than deep learning, and competitive with or better than deep models on the tabular, structured data most operational forecasting actually involves. If Tier 1 isn’t enough, this is usually the right next step, not a neural network.
Tier 3: deep learning (when it’s genuinely earned)
LSTMs, GRUs, Temporal Fusion Transformers, and hybrids do win, on complex, high-dimensional time series with sequential dependencies, many interacting variables, and enough data to feed them. The honest position: deep models demonstrate high accuracy and adaptability in complex environments. So this tier is real and valuable. It’s just the last place to start, not the first, and it’s justified by the data and the problem, not by the hype.
The part nobody puts in the demo: data and integration
This is where pragmatic forecasting is won or lost, and it’s the opposite of glamorous.
- Data quality is the ceiling. Clean, structured, centralized data is the precondition for any forecast to be trustworthy, and the research is blunt that accuracy depends heavily on data preparation. Companies with clean, centralized data spend far less time and money getting to a working forecast; those with fragmented, piecemeal data pay for it in both. It’s why we keep returning to the data foundation.
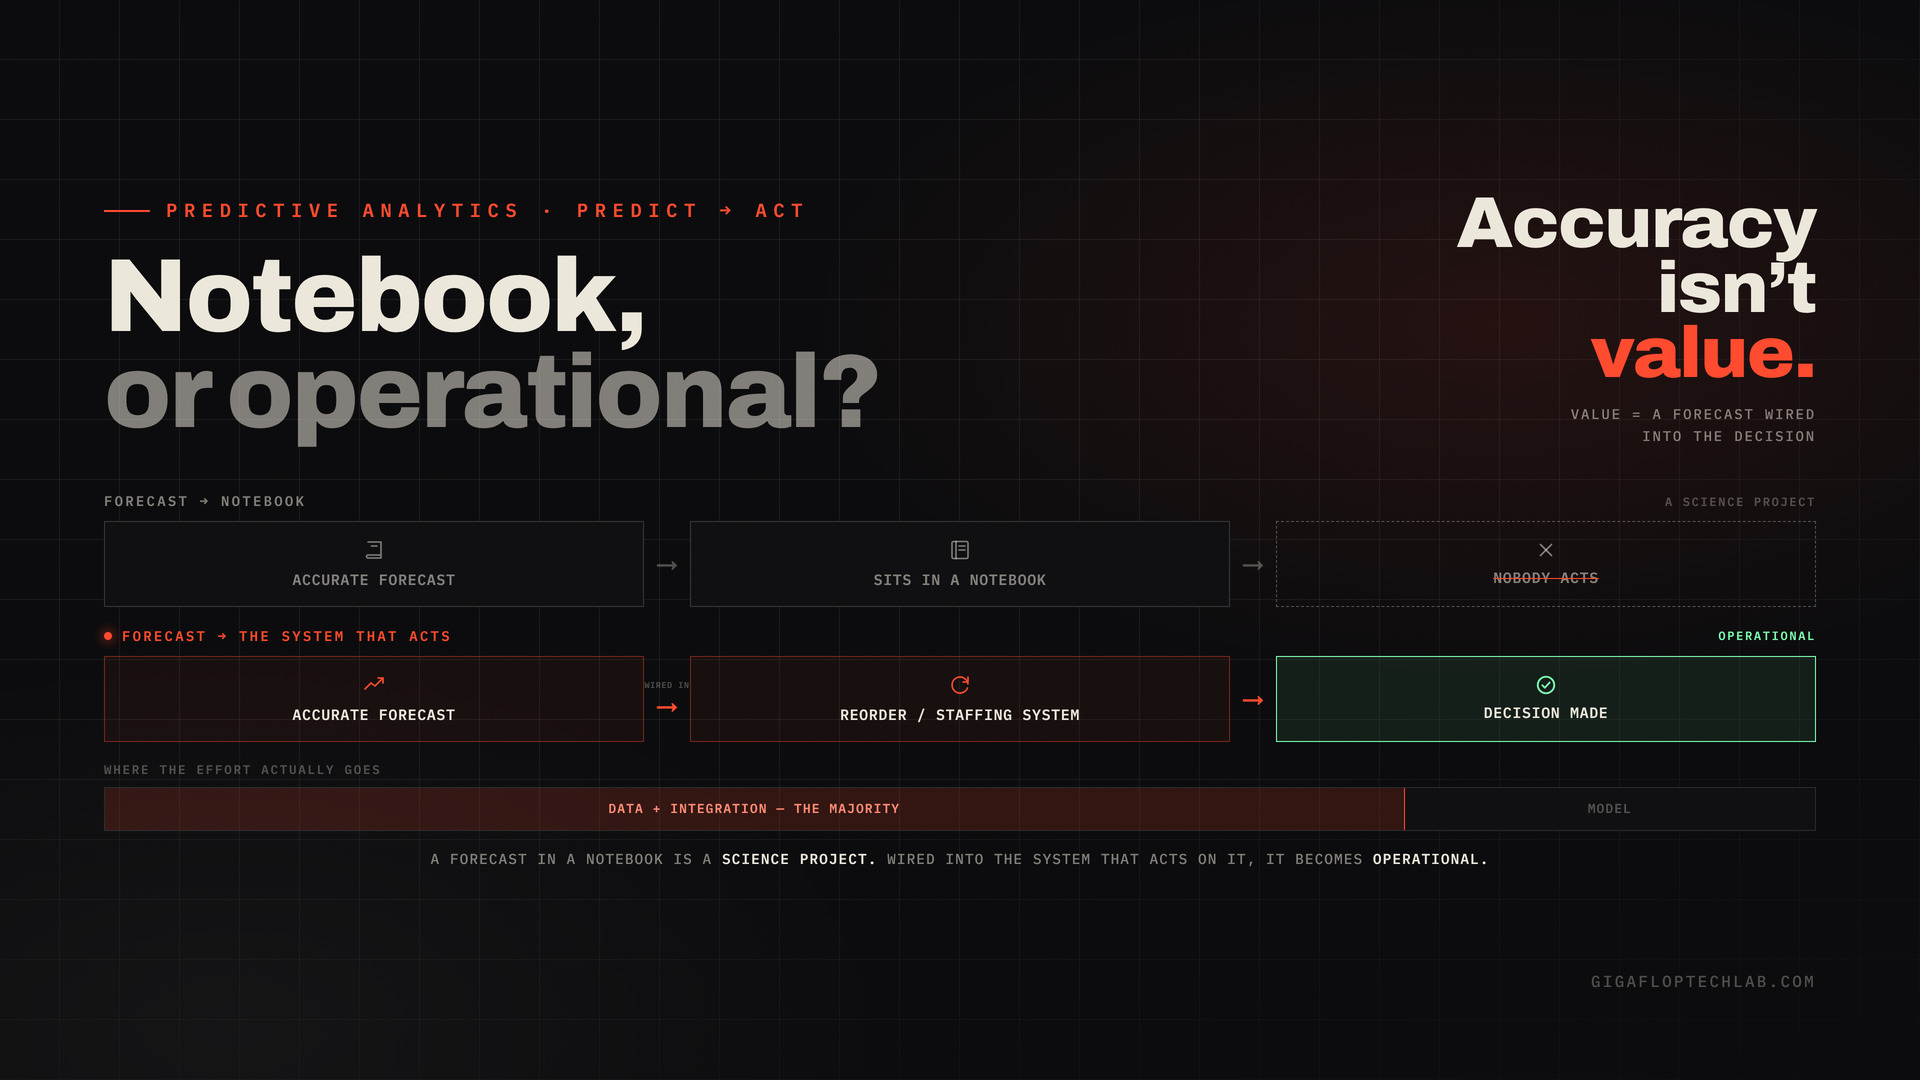
- Integration is what makes a forecast operational. A forecast that lives in a notebook isn’t operational forecasting, it’s a science project. The value only lands when the prediction flows into the workflow that acts on it: the reorder system, the staffing plan, the capacity decision. Remember the predict-versus-act distinction: a forecast informs, but something still has to act on it.
- Backtesting and monitoring, not one-time accuracy. Forecasts decay as conditions change. Regular backtesting and monitoring keep them honest, the same continuous-evaluation discipline as any production model.
The uncomfortable ratio: in most forecasting projects, the data and integration work is the large majority of the effort, and the model is the small minority. Teams that invert that ratio, spending most effort on the model and little on the data, are the teams whose forecasts don’t work. You can see how we weight that split in practice in our case studies.
How to scope a pragmatic forecasting project
- Start with one use case, narrow. One product line or region, not a company-wide rollout. Scope drives cost and risk, so prove it small, then expand.
- Establish the baseline first. Know the number to beat before building anything.
- Audit the data before the model. Is it clean, centralized, sufficient? If not, that’s the project. Fix it before reaching for sophistication.
- Pick the lowest tier that clears the accuracy bar the decision actually needs. A reorder decision that tolerates plus or minus 10% doesn’t need a Transformer.
- Design the integration from day one. How does the forecast reach the system that acts on it? If there’s no answer, you’re building a science project.
- Plan to backtest and monitor. A forecast is a living system, not a one-time deliverable.
The bottom line
Predictive analytics got a hype problem because the model is the photogenic part and the data work isn’t. But operational forecasting is won on the unphotogenic parts: a clean data foundation, the simplest model that clears the accuracy bar the decision needs, and integration that puts the forecast where the decision gets made. Deep learning is a real tool with a real place, earned by complex data, not assumed by default.
Match the model to the problem, not to the hype cycle. Start with a baseline, escalate only when the data and the accuracy gap justify it, and spend most of your effort where the ceiling actually is: the data and the integration. That’s not the exciting version of predictive analytics. It’s the one that ships forecasts people actually use.
Get a forecasting & data audit
Planning a forecasting initiative and tempted to start with the most sophisticated model you’ve heard of? The faster path is usually a clean data foundation and the simplest model that clears your accuracy bar.
Get a Forecasting & Data Audit → We’ll assess whether your data can actually support reliable forecasting, recommend the lowest model tier that meets your accuracy needs (baseline, then classical, then tree-based, then deep learning, escalated only when justified), and design the integration that turns a prediction into an operational decision. No hype, just a forecast that ships.
FAQs
Usually not as a starting point. For most operational forecasting (demand, inventory, capacity, staffing) classical time-series methods or tree-based models on clean data match or beat deep learning, while being cheaper, faster, and more interpretable. Deep models are extremely data-hungry and genuinely win on complex, high-dimensional sequential data with enough volume to feed them, but that’s the last tier to reach for, not the first.
Data quality and preparation, far more than model sophistication. Forecast accuracy depends heavily on data cleaning, missing-value handling, and feature selection. A brilliant model on messy data underperforms a simple model on clean data, and data-quality problems hit revenue at roughly a third of organizations. The model is the last mile; the data foundation is the road, and it sets your accuracy ceiling regardless of which model you choose.
An escalation ladder: start with a naive baseline (last period, same period last year, moving average) as the bar to beat; move to classical time-series or simple regression for clear seasonality and trend; step up to tree-based ML (gradient-boosted trees) for multiple features and non-linear relationships; and reach for deep learning only when complex, high-dimensional data justifies it. Underneath every tier, data quality and integration determine whether it works.
Most commonly because teams start with a sophisticated model before fixing data quality, then stall when the model starves on messy or insufficient data. Or because the forecast never gets integrated into the workflow that acts on it, which makes it a notebook science project rather than operational forecasting. The effort is usually inverted: most goes to the model, too little to the data and integration that actually set the ceiling.
When you have complex, high-dimensional time series with sequential dependencies and many interacting variables, plus enough historical data and external sources to feed a data-hungry model, and when the accuracy gain over a simpler model genuinely justifies the higher compute cost and lower interpretability. Deep models demonstrate high accuracy in complex environments; the discipline is earning your way up to them by exhausting simpler tiers first.
Integrate it into the system that acts on it, the reorder process, staffing plan, or capacity decision, so the prediction drives a decision rather than sitting in a dashboard or notebook. A forecast informs; something still has to act on it. Then backtest and monitor continuously, because forecasts decay as conditions change. Accuracy in isolation isn’t value; accuracy wired into a workflow is.