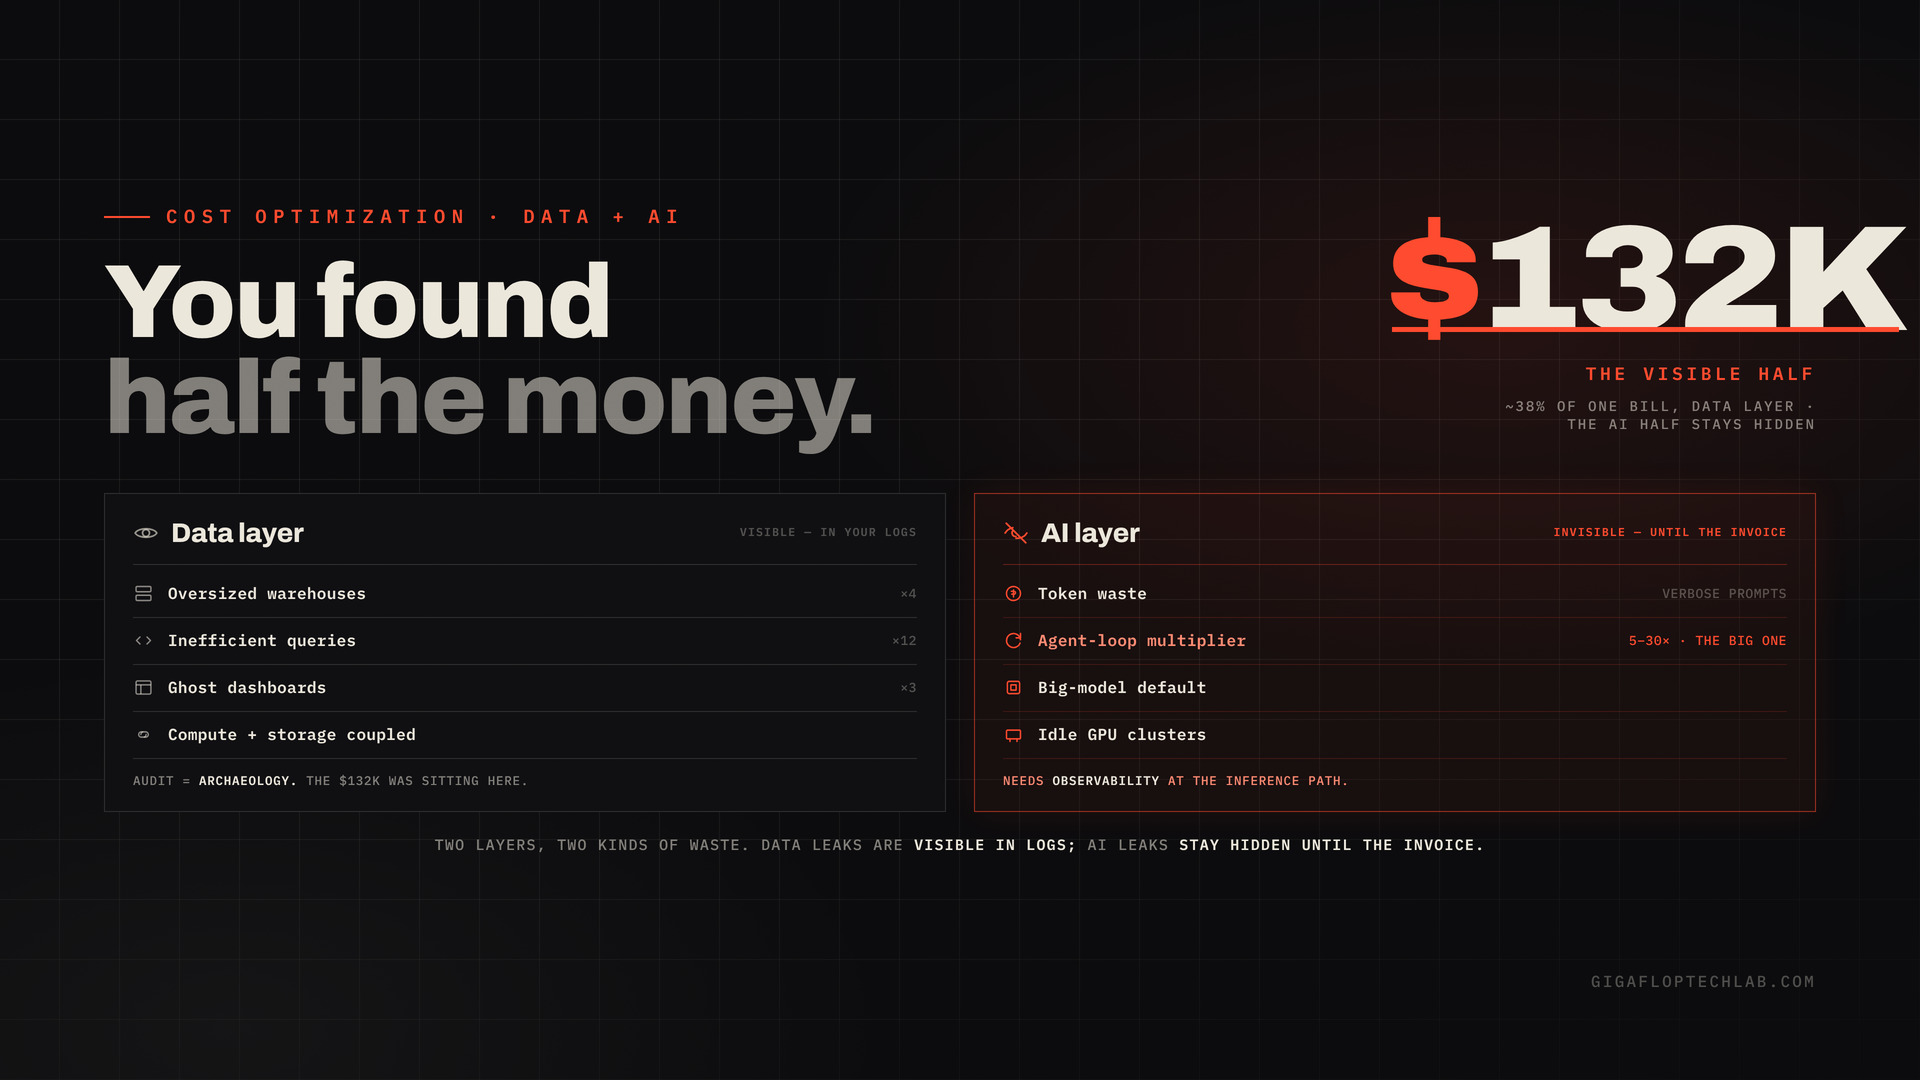
Here’s a number from a single engagement: $132,000 a year, about 38% of the bill, recovered from one Snowflake environment. Not by switching vendors or renegotiating a contract, but by finding where the money was quietly leaking: four oversized warehouses, twelve inefficient queries, and three “ghost” dashboards still burning compute that nobody had looked at in months.
That’s the “$132K question” in its literal form. The more useful version is the general one: where does AI cost optimization actually live in your stack, and why do most teams find only half of it? In 2026 your stack leaks money in two distinct places, and they hide very differently. The data layer wastes money in ways that are visible if you look. The AI layer wastes money in ways that stay invisible until the invoice arrives. Optimize one and ignore the other, and you’ll congratulate yourself on a saving while the bigger leak keeps running.
Let’s map both, starting with the one we cut $132K from.
Layer 1: data cost (the leaks you can see if you look)
This is the classic, well-understood territory, and it’s where that $132K came from. Data and warehouse spend leaks in predictable places.
- Oversized warehouses and compute. Provisioned for a peak that rarely happens, then running at a fraction of capacity the rest of the time (four of them, in the engagement above). The tell: your bill rises faster than your data volume, and that gap is waste, not growth.
- Inefficient queries. A handful of expensive, poorly written or un-optimized queries often account for a wildly disproportionate share of compute (twelve, in that case). Fixing the worst offenders is frequently the single highest-ROI move.
- Ghost dashboards and pipelines. Reports and refreshes nobody uses anymore, still running on schedule, still billing (three of them, in that engagement). Pure dead weight, and a big reason we argue the dashboard’s days are numbered.
- No separation of compute from storage. Architectures that couple the two force you to scale and pay for both even when you only need one, a permanent surcharge baked into the design. Avoiding that is half the point of a lean data stack.
None of this is exotic. It shows up in query logs, warehouse utilization, and usage analytics if someone goes looking. The reason it persists isn’t that it’s hidden. It’s that nobody owns the job of looking, which is exactly why a focused audit so reliably finds a big number: the waste was sitting in plain sight, unexamined.
Layer 2: AI cost (the leaks you can’t see until the invoice)
This layer is newer, faster-growing, and more dangerous, because AI spend is probabilistic, context-dependent, and invisible until the cloud invoice arrives. Traditional FinOps tooling, built to measure server uptime and bandwidth, can’t even parse it. AI cost lives in four places that compound.
- Inference and token spend. This scales with prompt length, model tier, and tokens per request. The most common waste is verbose system prompts repeated on every call, plus redundant generation that produces the same answer twice. Semantic caching can cut cost sharply in high-repetition workloads (reported as high as ~73%), because a cache hit skips the inference call entirely.
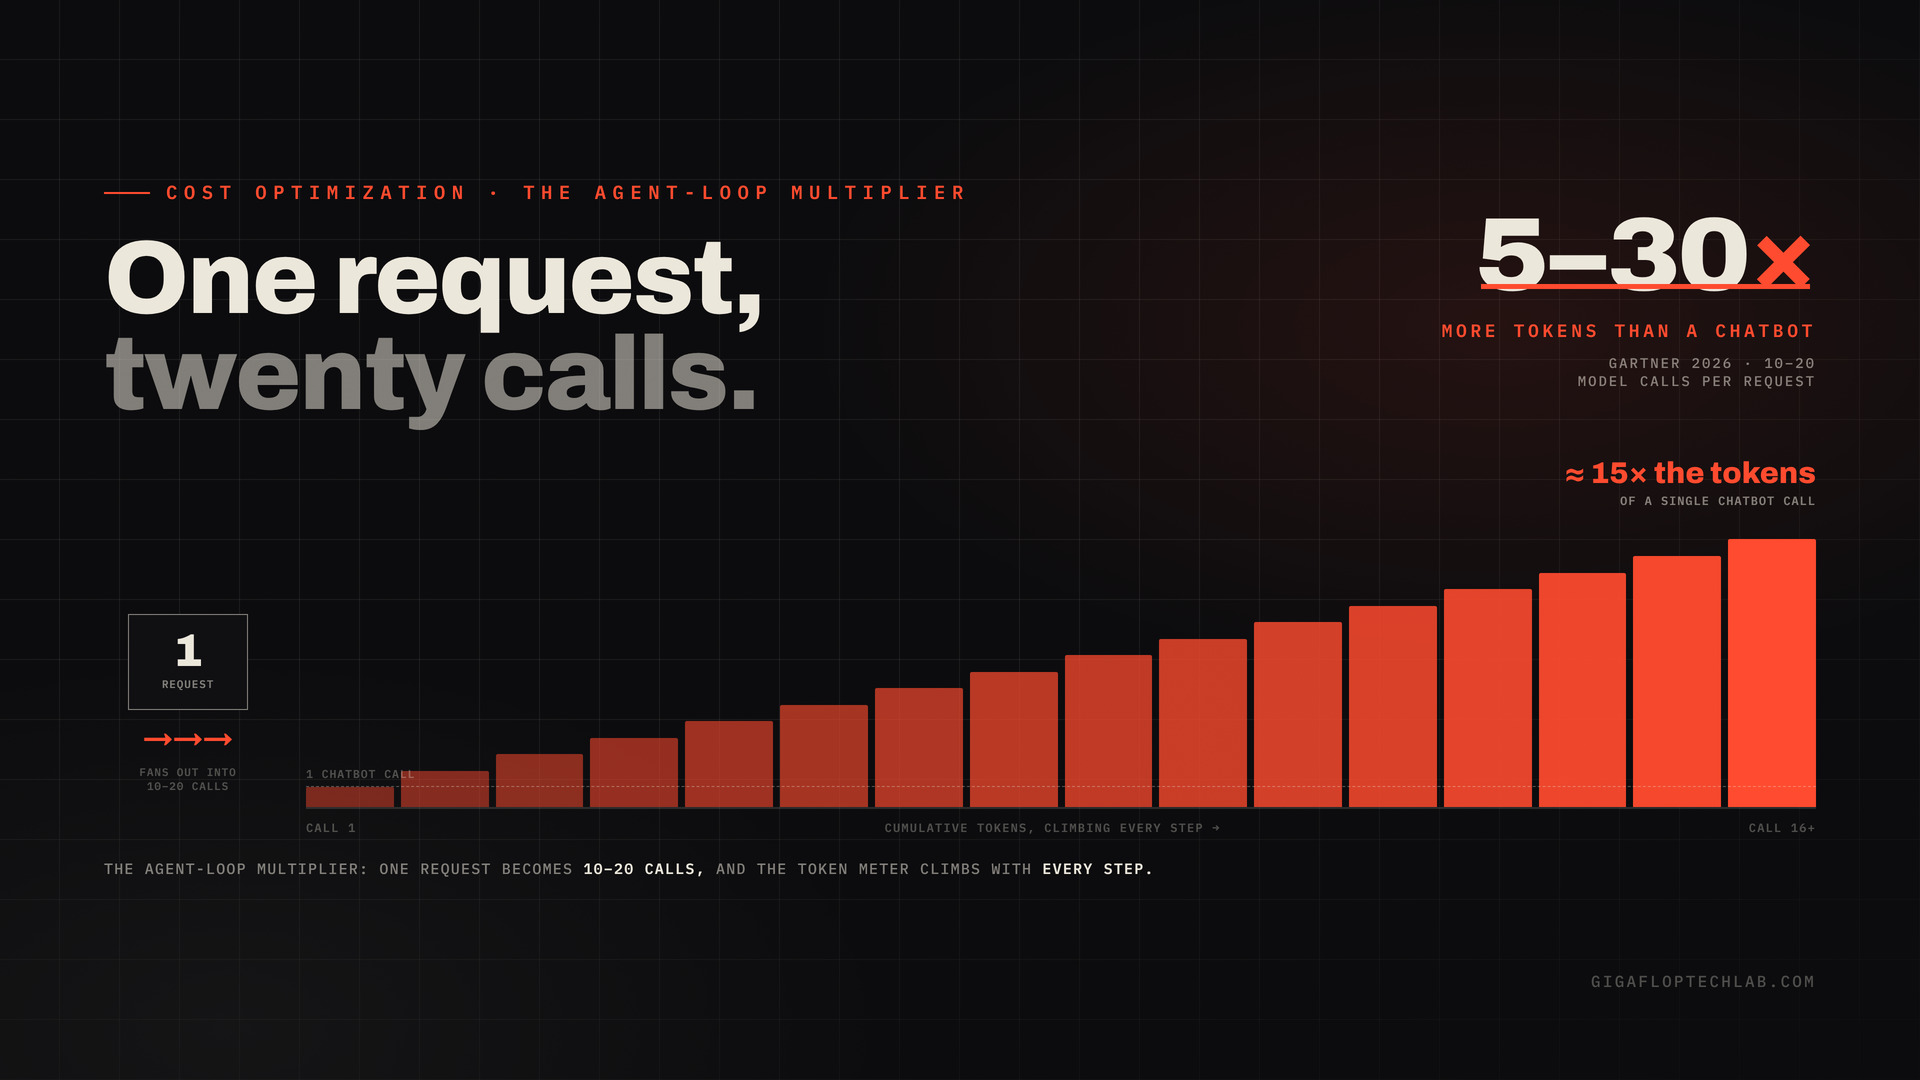
- The agent-loop multiplier, the big one. Agentic workflows fire many model calls per user task. Gartner’s 2026 analysis found agentic models require 5 to 30 times more tokens per task than a standard chatbot, with agents commonly triggering 10 to 20 calls per request. Teams that piloted with single-query chatbots and then shipped multi-step agents at scale hit cost multiplications they never modeled. The ROI math that justified the build often assumed chatbot-level consumption and was off by an order of magnitude. (This is one more reason pilots quietly miss their numbers.)
- The “big model” default. Reaching for the most powerful and most expensive model for tasks a smaller or routed model would handle fine. Model routing, sending easy requests to cheap models and hard ones to frontier models, is often the highest-leverage AI saving available.
- Infrastructure and operational overhead. Idle GPU clusters burning spend at low utilization, and engineering time lost to debugging cost-allocation anomalies because no one can tell which team or feature drove a spike.
The structural trap: AI workloads are often funded from experimentation budgets, so they escape standard FinOps scrutiny until they’re in production at volume and the invoice becomes a board-level surprise. Usage growth has outpaced falling per-token prices, so “models are getting cheaper” is cold comfort when your agents burn 20 times the tokens.
Why teams find only half the money
Put the two layers together and the pattern is clear. Data waste is an archaeology problem: it’s there in the logs, and you just have to dig. A cost audit reliably surfaces it, which is where the $132K came from. AI waste is an observability problem: it isn’t in your normal logs at all, so it needs instrumentation at the inference path to even see, let alone control.
Teams from a data-engineering background often nail Layer 1 and have no visibility into Layer 2. Teams excited about AI often watch token dashboards and never audit the warehouse that’s quietly burning $132K. The money lives in both, and the disciplines to find it are different, which is why “where does cost optimization live?” is the right question to ask before you start.
How to actually find your number
A practical sequence, in rough ROI order:
- Audit the data layer first. It’s the fastest visible win: warehouse utilization, the top-N most expensive queries, unused dashboards and pipelines, compute/storage coupling. This is where the quick, large, visible savings usually are.
- Instrument the AI layer before you optimize it. You can’t cut what you can’t see. Get cost attribution by feature and team, plus per-request token visibility at the inference path. FinOps reports spend after the fact; gateway-level controls prevent it. This is the same instrument-first discipline in our production-readiness checklist.
- Attack the agent-loop multiplier. Audit how many model calls each workflow actually fires. This is where the scariest, fastest-growing spend hides.
- Route models and cache aggressively. Cheapest-model-that-works per task, semantic caching for repetitive queries, and concise prompts.
- Set budget alerts at 80%, not 100%. At 100% there’s nothing left to do; an 80% alert buys a week to course-correct. Review inference weekly, because it moves fast.
Worked example (illustrative). If a focused data audit recovers roughly 30-40% of a warehouse bill (the range behind that $132K), and an AI-cost pass cuts inference 20-70% through routing and caching on high-repetition workloads, the combined recovery on a stack that spends on both is usually far larger than teams expect, because they’d only been looking at one side. These ranges are directional; your number depends on your stack and usage, which is the whole point of auditing rather than guessing.
The bottom line
The $132K wasn’t found by being clever about Snowflake. It was found by looking, at warehouses, queries, and dashboards that everyone assumed were fine because no one owned the job of checking. That’s the whole lesson of data-layer cost: the waste is visible, and the discipline of looking is what’s missing.
But in 2026, looking only at the data layer means finding half the money. The AI layer leaks differently: invisibly, probabilistically, with agent loops multiplying token spend 5 to 30 times and experimentation budgets hiding it from FinOps until the invoice lands. The teams that control their costs treat both as first-class: archaeology on the data side, observability on the AI side. Ask the $132K question about your whole stack, not half of it, and the bigger number is usually the one you weren’t looking at.
Find your number
Confident you’ve optimized your cloud bill, but have you actually looked at both the data layer and the AI inference layer? Most teams have cut one and never instrumented the other, and the audit usually pays for itself in the first finding.
Book a Cost Audit → We’ll audit the data layer for the fast, visible savings (warehouse utilization, your most expensive queries, ghost dashboards), instrument the AI layer you currently can’t see (per-request tokens, agent-loop call counts, model routing), and hand you a prioritized recovery plan. The first finding usually covers the cost of the look.
FAQs
Where does cloud and AI cost waste actually hide?
Should I optimize data costs or AI costs first?
In two distinct layers. The data layer leaks through oversized warehouses, inefficient queries, ghost dashboards, and coupled compute/storage, waste that’s visible in logs if someone looks (one audit recovered about $132K/year, roughly 38%). The AI layer leaks through token waste, the agent-loop multiplier, oversized models, and idle GPUs, waste that’s invisible until the invoice arrives because traditional FinOps tools can’t parse inference spend. Most teams optimize one and ignore the other.
Usually the agent-loop multiplier. Agentic workflows fire many model calls per task. Gartner’s 2026 analysis found agents use 5 to 30 times more tokens per task than a chatbot, often 10 to 20 calls per request. Teams that piloted with single-query chatbots and then deployed multi-step agents at scale hit cost multiplications they never modeled, because the ROI math assumed chatbot-level token consumption. Verbose prompts, redundant generation, and defaulting to the most expensive model compound it.
The highest-leverage tactics: route models (send easy requests to cheaper models, reserve frontier models for hard ones), cache aggressively (semantic caching can cut cost sharply, up to about 73% in high-repetition workloads, since a cache hit skips inference entirely), trim verbose and repeated prompts, and audit how many calls each agent workflow actually fires. Instrument spend at the inference path first, because you can’t cut what you can’t see.
It varies, but recovering 30-40% is common when waste has accumulated unexamined. One engagement cut about $132K/year (roughly 38%) by fixing four oversized warehouses, twelve inefficient queries, and three unused dashboards. The savings are usually large precisely because the waste is visible in logs and utilization data but nobody owned the job of looking. Your figure depends on your stack and how long it’s gone un-audited.
Cloud FinOps measures predictable things, like server uptime, storage, and bandwidth, and scales with users or requests. AI FinOps has to measure token velocity, context-window utilization, prompt efficiency, and per-request model calls, because AI spend is probabilistic and context-dependent. Legacy cloud billing tools can’t parse API context windows, so they can’t distinguish necessary intelligence from wasteful repetition, which is why AI cost needs its own observability at the inference path.
Usually data first, because the wins are fast and visible: audit warehouse utilization, your most expensive queries, and unused dashboards for quick recovery. But don’t stop there. Instrument the AI layer in parallel, because that’s where the fastest-growing and most invisible spend hides, especially agent loops. The money lives in both, and the biggest mistake is optimizing one and assuming you’re done.